Gene List Table
Overview
A Gene List is a custom user-created list of genes based on the transcriptomics datasets of interest. Each Gene List displays all of the genes present in selected datasets, their functions, and summaries of their expression levels in various samples or comparisons. A Gene List can be dynamically filtered based on the identifiers, product/function, expression levels, or up/down regulation in one or more comparisons. Any subset of genes of interest can be downloaded along with the annotations and expression values as tab-delimited text or Excel file; or saved as a Workspace group for further analysis. A complementary Heatmap Viewer enables quick sorting or clustering of genes and comparisons; and visualization of genes that are similarly expressed across one or more comparisons.
See also
Examining Transcriptomics Data Tutorial
Accessing/Creating Transcriptomics Gene List Table
A Gene List may be accessed while under the Transcriptomics Tab (available on any Taxonomy or Genome level landing page) in the following ways:
*Clicking the Genes Action Button with one or more rows selected in the Experiments Table: Opens the Transcriptomics Genes Filter Tool and Table/Heatmap page, loaded with the genes corresponding to the selected experiments. See Transcriptomics Experiments and Comparisons for more information.
*Clicking the Genes Action Button with one or more rows selected in the Comparisons Table: Opens the Transcriptomics Genes Filter Tool and Table/Heatmap page, loaded with the genes corresponding to the selected comparisons. See Transcriptomics Experiments and Comparisons for more information.
Gene List Table and Filter
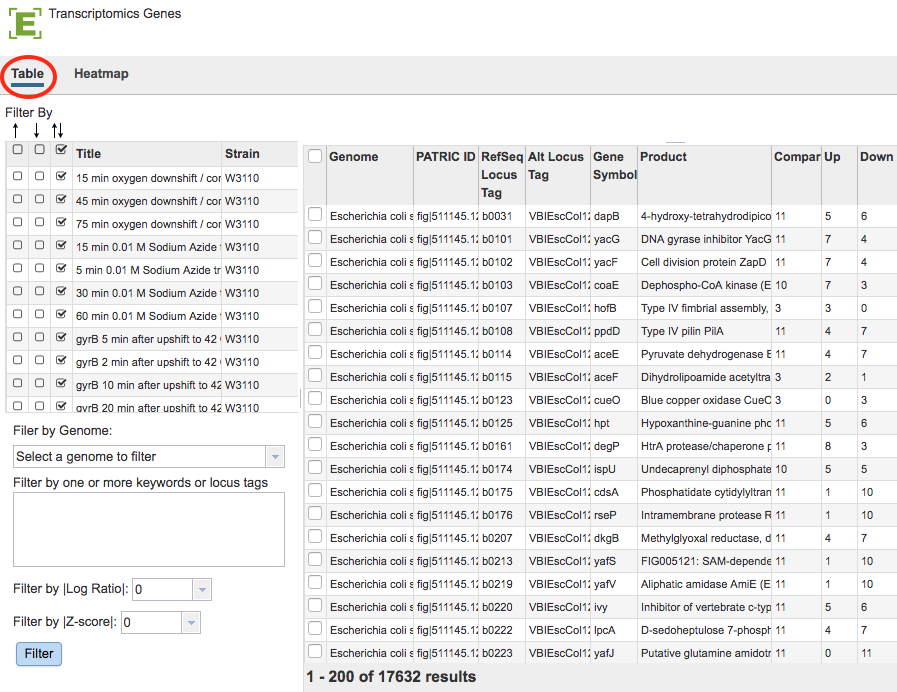
Results will be shown in a Gene List Table and Filter, shown below.

Gene List Filter Tools
The Filter Tool on the left hand side of the table provides the following functionality:
Filter by up- or down-regulation by clicking the corresponding up, down, or up/down (^, v, or ^v) checkbox beside the condition Title.
Filter by Gnome by selecting a genome in the dropdown list and clicking the Filter Button.
Filter by Keyword or Locus Tag by entering the desired keyword(s) in the text box and clicking the Filter Button.
Filter by |Log Ratio| by selecting a value from the dropdown list and clicking the Filter Button.
Filter by |Z-score| by selecting a value from the dropdown list and clicking the Filter Button.
Gene List Table Tools
The data in the Gene List Table provides summary information for the selected genes including Genome name, ID for the gene, RefSeq Locus Tag if available, Alternate Locus Tag if available, Gene Symbol, gene Product, number of Comparisons associated with the gene, number of comparisons with Up regulation, number of comparisons with Down regulation.
Within Gene List Table and you may do the following:
Sort the list of genes by clicking on the column headers.
Download the entire contents of the table in CSV (Excel) format by clicking the Download button above the table on the right side.